The challenge
District comparison, loyalty analysis, and coupon planning are fragmented across spreadsheet workflows.
01 / HERO & PRODUCT SHOWCASE / CVS HEALTH / DISTRICTIQ / RETAIL RESEARCH
From fragmented spreadsheets to explainable district comparisons: a product and UX exploration of loyalty behavior, coupon planning, and the evidence behind a recommendation.
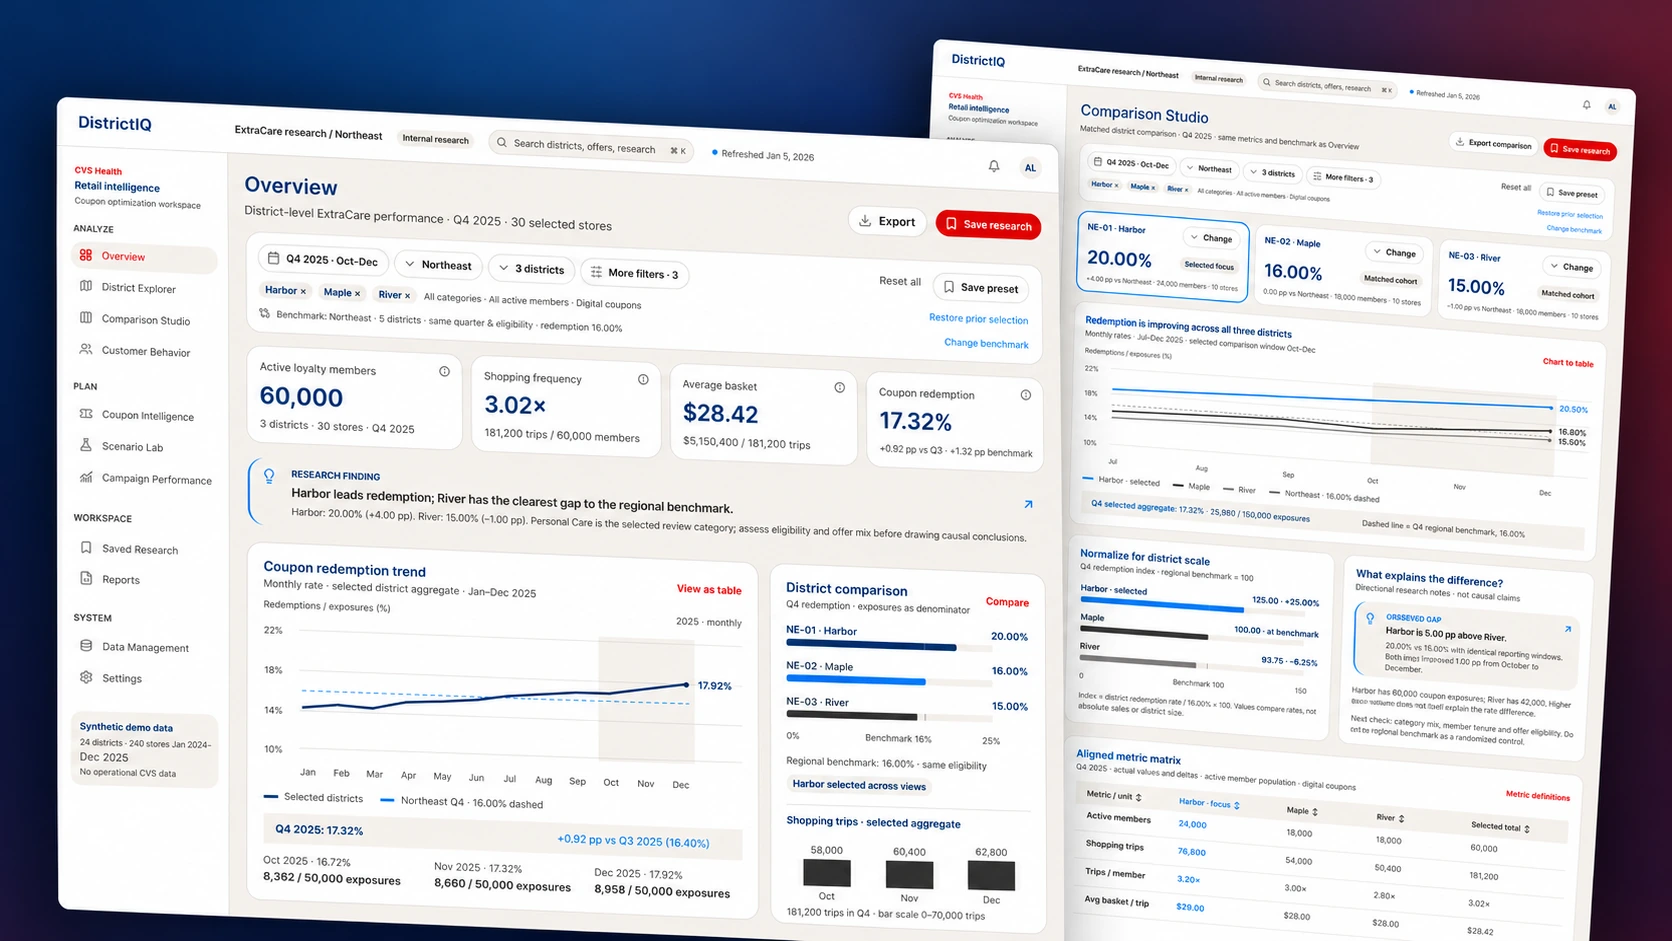
Independent design concept. Interface data is illustrative. DistrictIQ Overview and Comparison Studio bring district performance, loyalty metrics, coupon redemption trends, and side-by-side analysis into one connected workspace.
02 / EXECUTIVE SUMMARY
THE PROJECT IN 30 SECONDS
District comparison, loyalty analysis, and coupon planning are fragmented across spreadsheet workflows.
Design one research workspace with matched context, explainable metrics, and traceable assumptions.
Eleven connected screens organize district analysis, coupon planning, campaign performance, and saved research around a consistent set of metrics.
03 / PROBLEM & OPPORTUNITY
DistrictIQ brings district comparisons, loyalty-behavior analysis, and coupon planning into a shared workspace. Each screen keeps the selected population, reporting period, metric definitions, and benchmark close to the analysis.
Compare districts, inspect behavior, and trace a category gap back to underlying counts and definitions.
Connect an analytical signal to offer eligibility and scenario assumptions without promising incremental lift.
Keep the cohort, benchmark, snapshot, and methodology attached when a finding becomes a shared recommendation.
The workspace supports district exploration, offer review, and sharing findings with their supporting context.
04 / DISCOVERY & INSIGHTS
The work combines requirements synthesis, static design inspection, and a heuristic analytical review. It examines information structure, numerical consistency, chart/table access, and how limitations are communicated.
Overview establishes the research context, Comparison Studio aligns district metrics, and Data Management explains the definitions behind the charts.
Different district exposure counts make a simple mean misleading → comparisons need a consistent denominator → show the summed counts beside the aggregate rate.
05 / STRATEGY & DESIGN DECISIONS
The design moves from summary to analysis to detail. The challenge is to make a dense analytical workspace scannable while preserving enough context for a reader to question the headline.
A common period, district, population, and benchmark strip is designed to travel with the analysis. Reset and restore affordances express recovery intent.
Pair rates with counts, units, and definitions. Keep exact-value tables and methodology within reach of charts and findings.
Saved Research and Reports retain the original snapshot and assumptions so a conclusion stays connected to its source.
The screen sequence moves from an overview signal to district comparison, offer review, scenario assumptions, and a saved research record.
06 / ITERATIONS & VALIDATION
Consistent filter bars, metric cards, tables, and chart legends connect the screens. Selected districts and reporting periods remain visible while the level of analytical detail changes.
Aggregation rules, benchmark labeling, common context, and routes from summary to exact values.
Comparison accuracy, denominator comprehension, finding traceability, and restoring saved context.
Metric definitions, benchmark context, snapshot details, and exact-value tables accompany the headline figures.
07 / FINAL EXPERIENCE
Overview, District Explorer, Comparison Studio, and Customer Behavior retain a common selection.
Coupon Intelligence, Scenario Lab, and Campaign Performance expose offer context and assumptions.
Saved Research, Reports, Data Management, and Settings document provenance and consistent defaults.
PRODUCT CAPABILITIES / SCREEN REVIEW
Select a destination to inspect its static design. Open the full-size image for detailed reading.
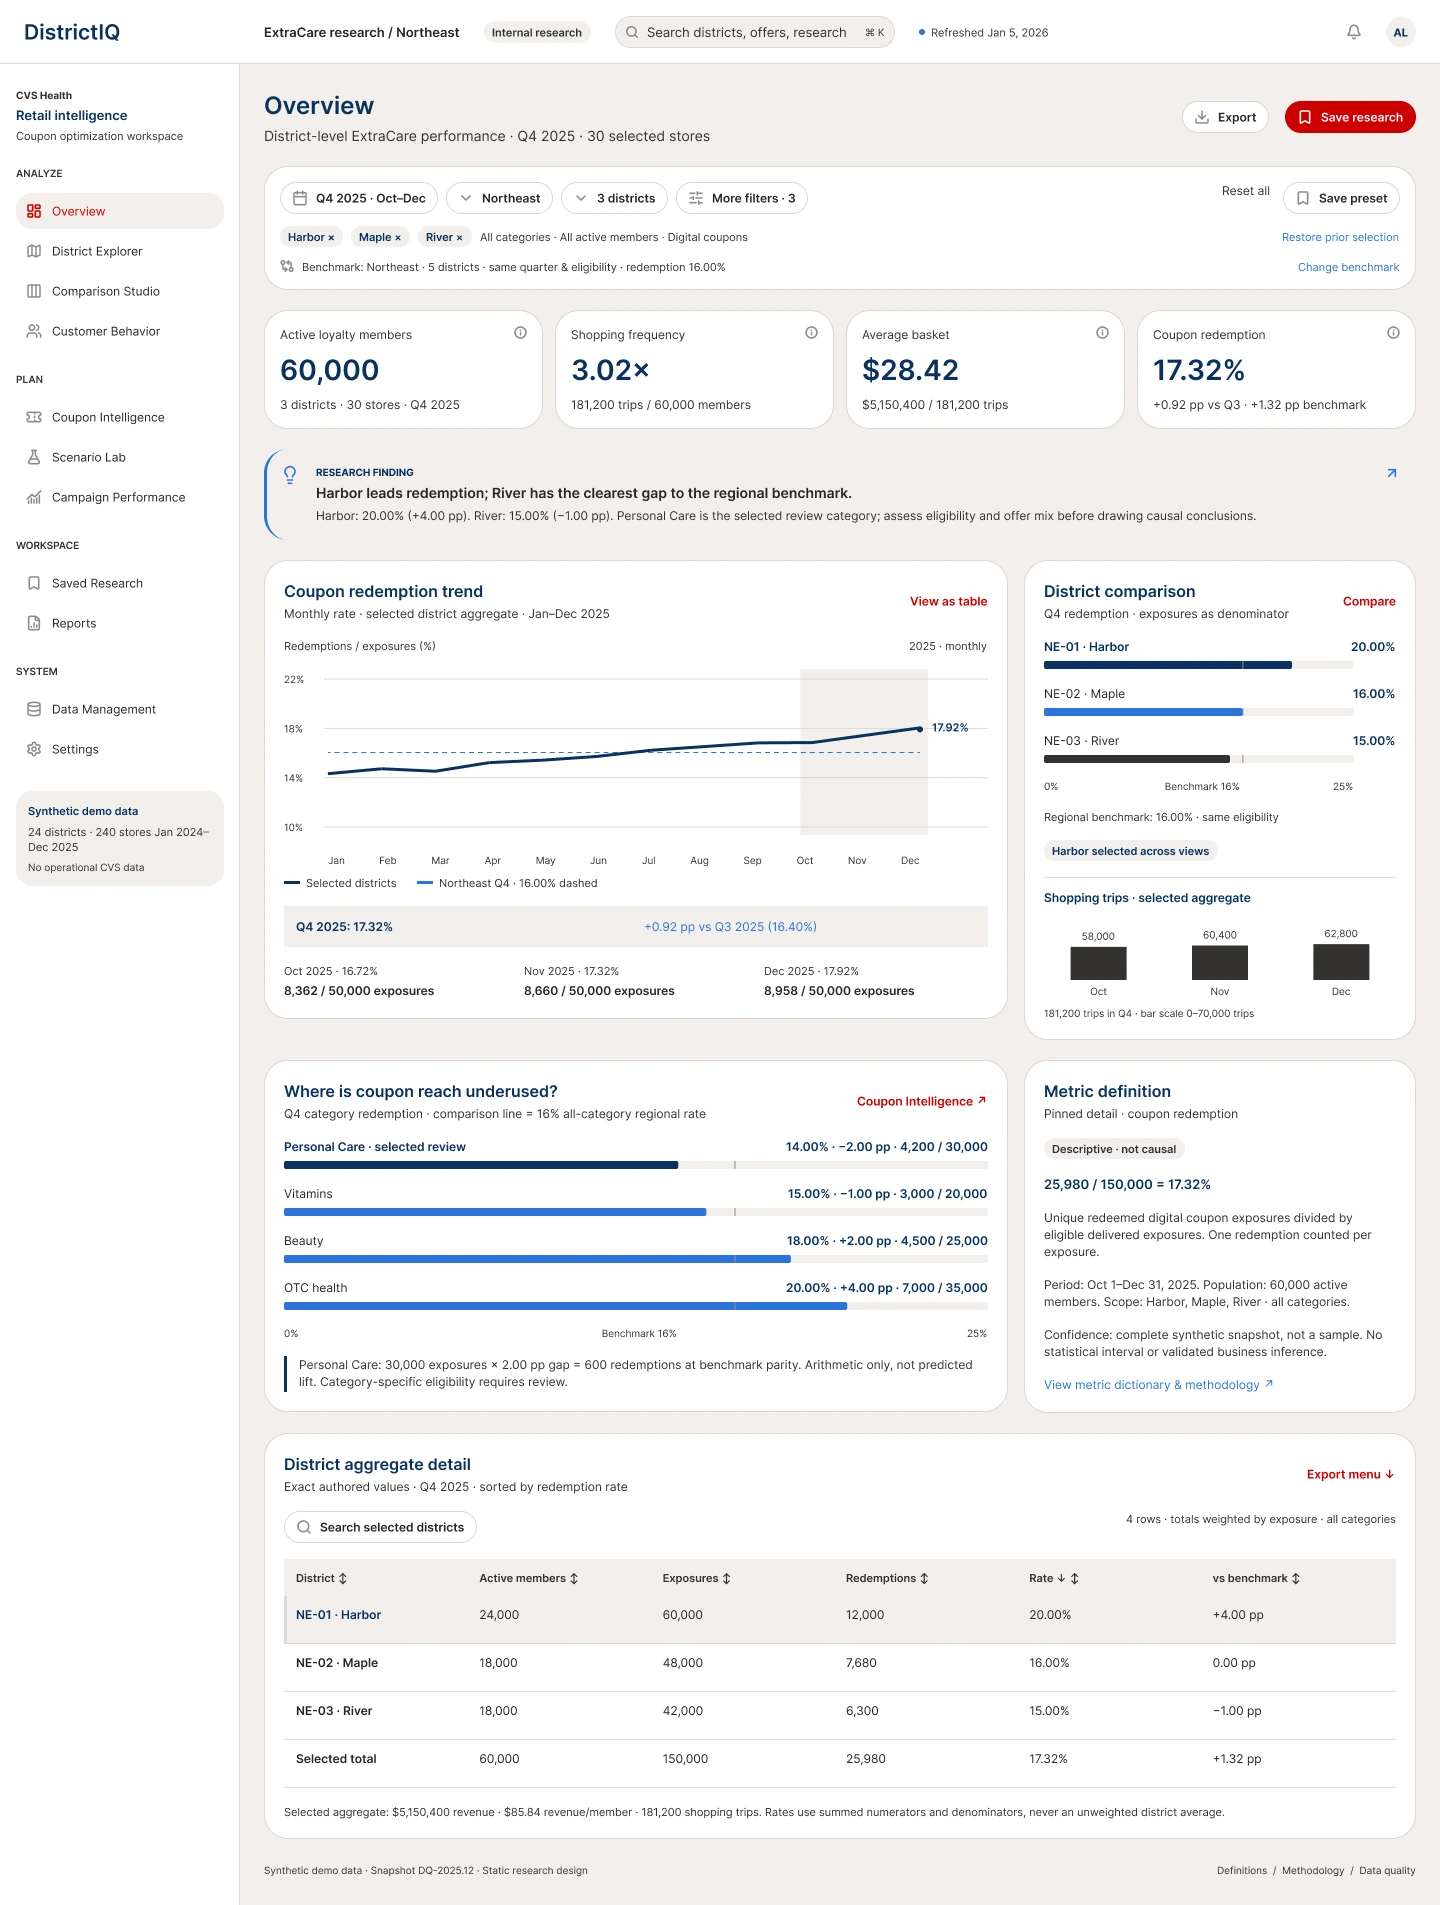
A shared research context precedes the headline metrics. Counts, units, selected districts, reporting period, and the regional benchmark remain visible.
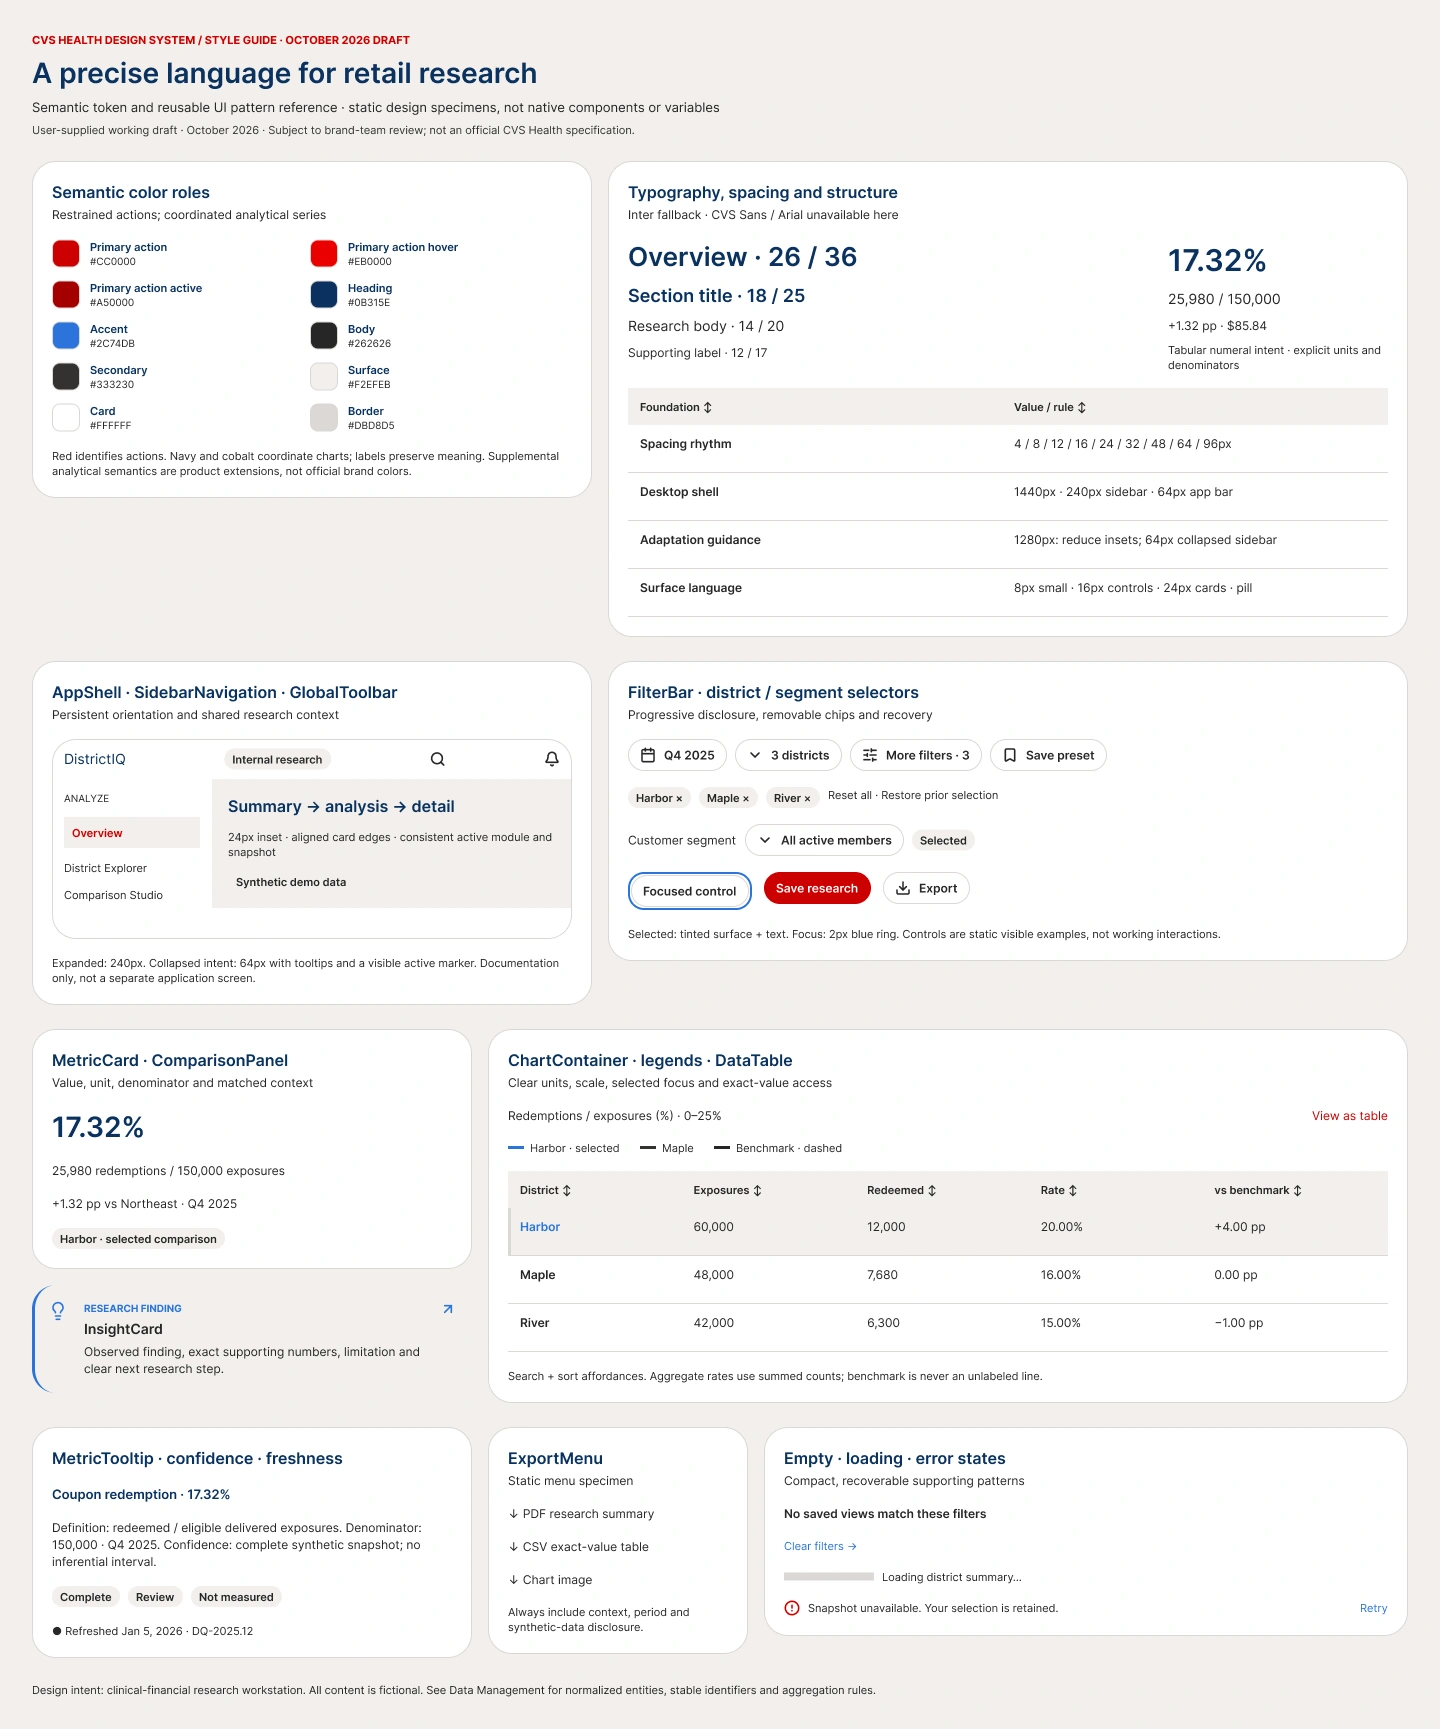
The design foundation brings together restrained action color, coordinated analytical series, clear labels, and reusable metric, filter, chart, table, and supporting-state patterns.
Region → District → Store provides organizational context. DistrictMetric combines period, category, and segment with additive counts. Offers, campaigns, saved scenarios, and research workspaces use stable IDs and snapshot versions to preserve provenance.
Data Management connects regions, districts, stores, reporting periods, offers, and research snapshots. Supporting patterns show focus treatments, chart alternatives, and recoverable interface states.
08 / OUTCOMES & IMPACT
Eleven destinations connect high-level performance summaries with detailed district comparisons, offer research, campaign records, and metric definitions.
Cohort selections, denominators, and exact values stay within reach of the summary charts.
Reports pair executive summaries with district comparisons, methodology, and exact-value appendices.
Eleven application screens share a design foundation, metric vocabulary, and consistent data presentation.
09 / REFLECTION & NEXT STEPS
Interview researchers, strategists, and managers, then observe an authorized research task and the workbooks it depends on.
Audit anonymized definitions, eligibility rules, denominators, deduplication, provenance, and permissible claim language.
Assess district comparison, denominator interpretation, finding traceability, and context recovery in an implemented experience.
Keep the question, the calculation, and the limitation close enough to read together. Decision quality depends on comparability, provenance, and explainability.